Wopisanje
A comprehensive debugging toolkit for WordPress developers and site administrators. This plugin gives you complete control over WordPress debugging without editing wp-config.php files or using FTP.
Quick Demo
Key Features
- WP-CLI Style Terminal: Execute WordPress commands directly from your browser with syntax highlighting and auto-completion
- Database Tools: Run SQL queries, view table structures, and optimize your database (super admin only)
- Debug Constants Manager: Toggle all WordPress debug constants with a single click
- Log Viewer: View, filter, and analyze debug logs with syntax highlighting and error categorization
- Query Inspector: Examine database queries with SAVEQUERIES support
- Email Notifications: Get alerts when new errors appear in your logs
- Safe Mode: Quickly disable all plugins except selected ones for troubleshooting
- Custom Log Paths: Set custom log file locations with filter support
Debug Constants Available
- WP_DEBUG – Default Value: true – Enables WordPress debug mode
- WP_DEBUG_LOG – Default Value: true – Saves all errors to a debug.log file
- SCRIPT_DEBUG – Default Value: false – Uses development versions of core JS and CSS files
- WP_DEBUG_DISPLAY – Default Value: false – Controls whether debug messages display on screen
- SAVEQUERIES – Default Value: false – Saves database queries for analysis
Developer Tools
- Terminal Commands: Use WP-CLI style commands like
wp core versionorwp plugin list - Database Explorer: Run SELECT queries and view results in a formatted table
- Stack Trace Analysis: Visualize error stack traces for easier debugging
- Hook Inspector: View all registered hooks and their callbacks
- Environment Detection: Development features are automatically hidden in production
Developer API: Apply custom filters like
apply_filters('wp_debuglog_log_file_path', $file);to extend functionality
Please note: Constant values will be restored on plugin deactivation as it was before activating the plugin.
Screenshots
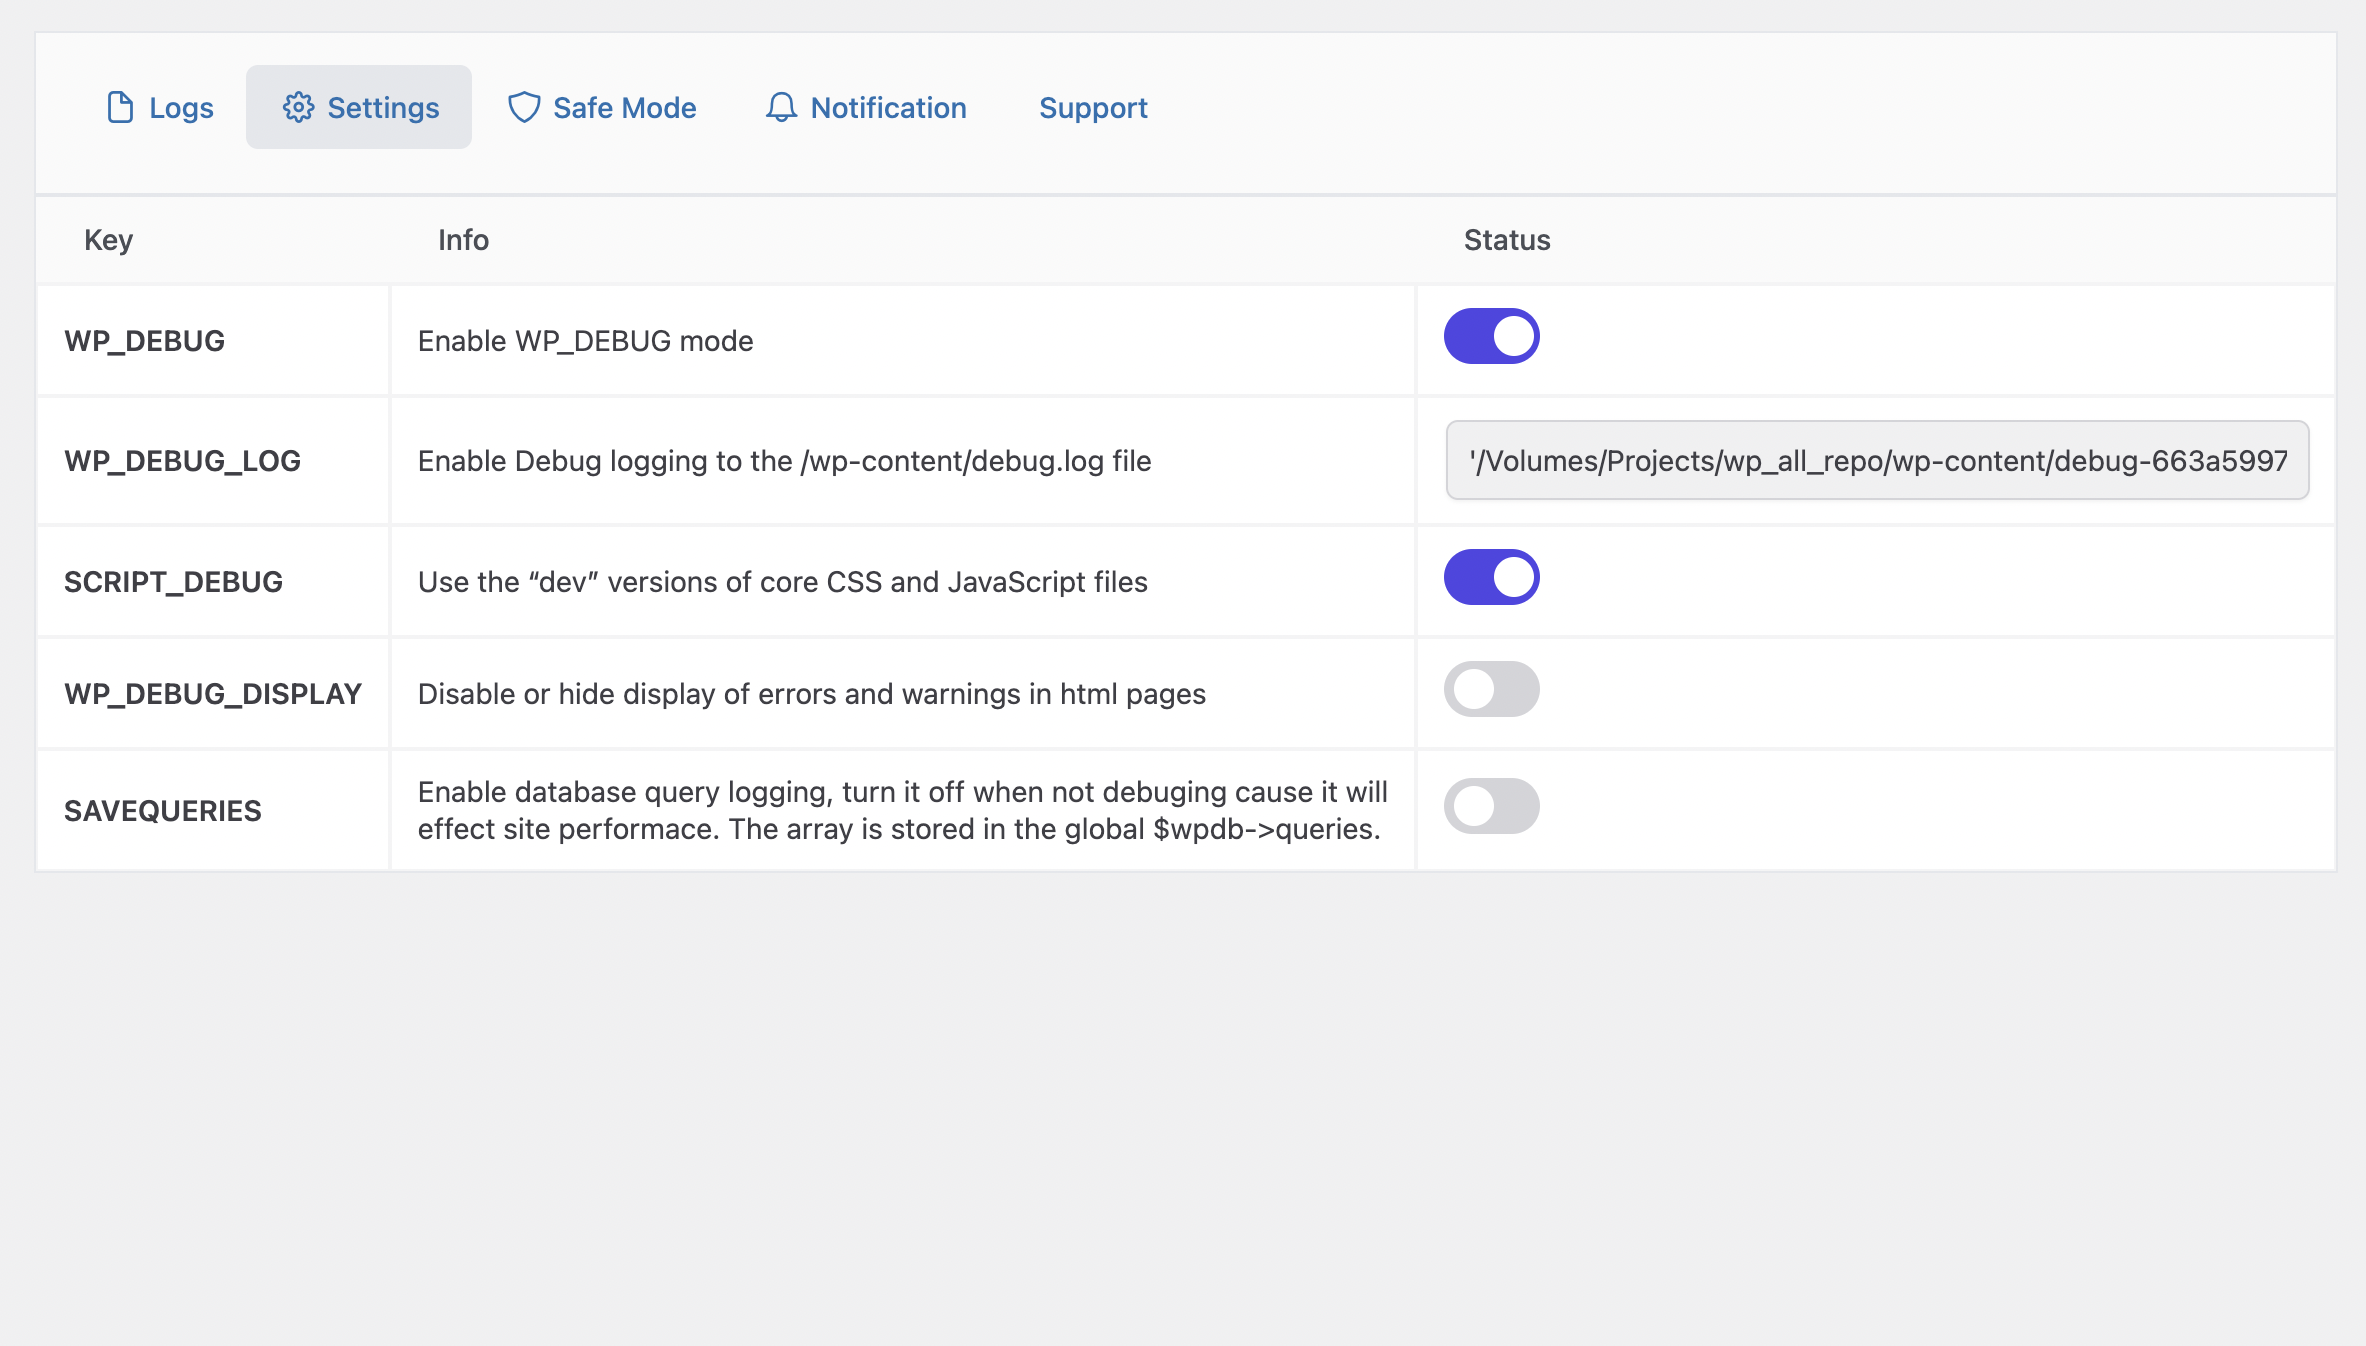
** Plugin Settings ** 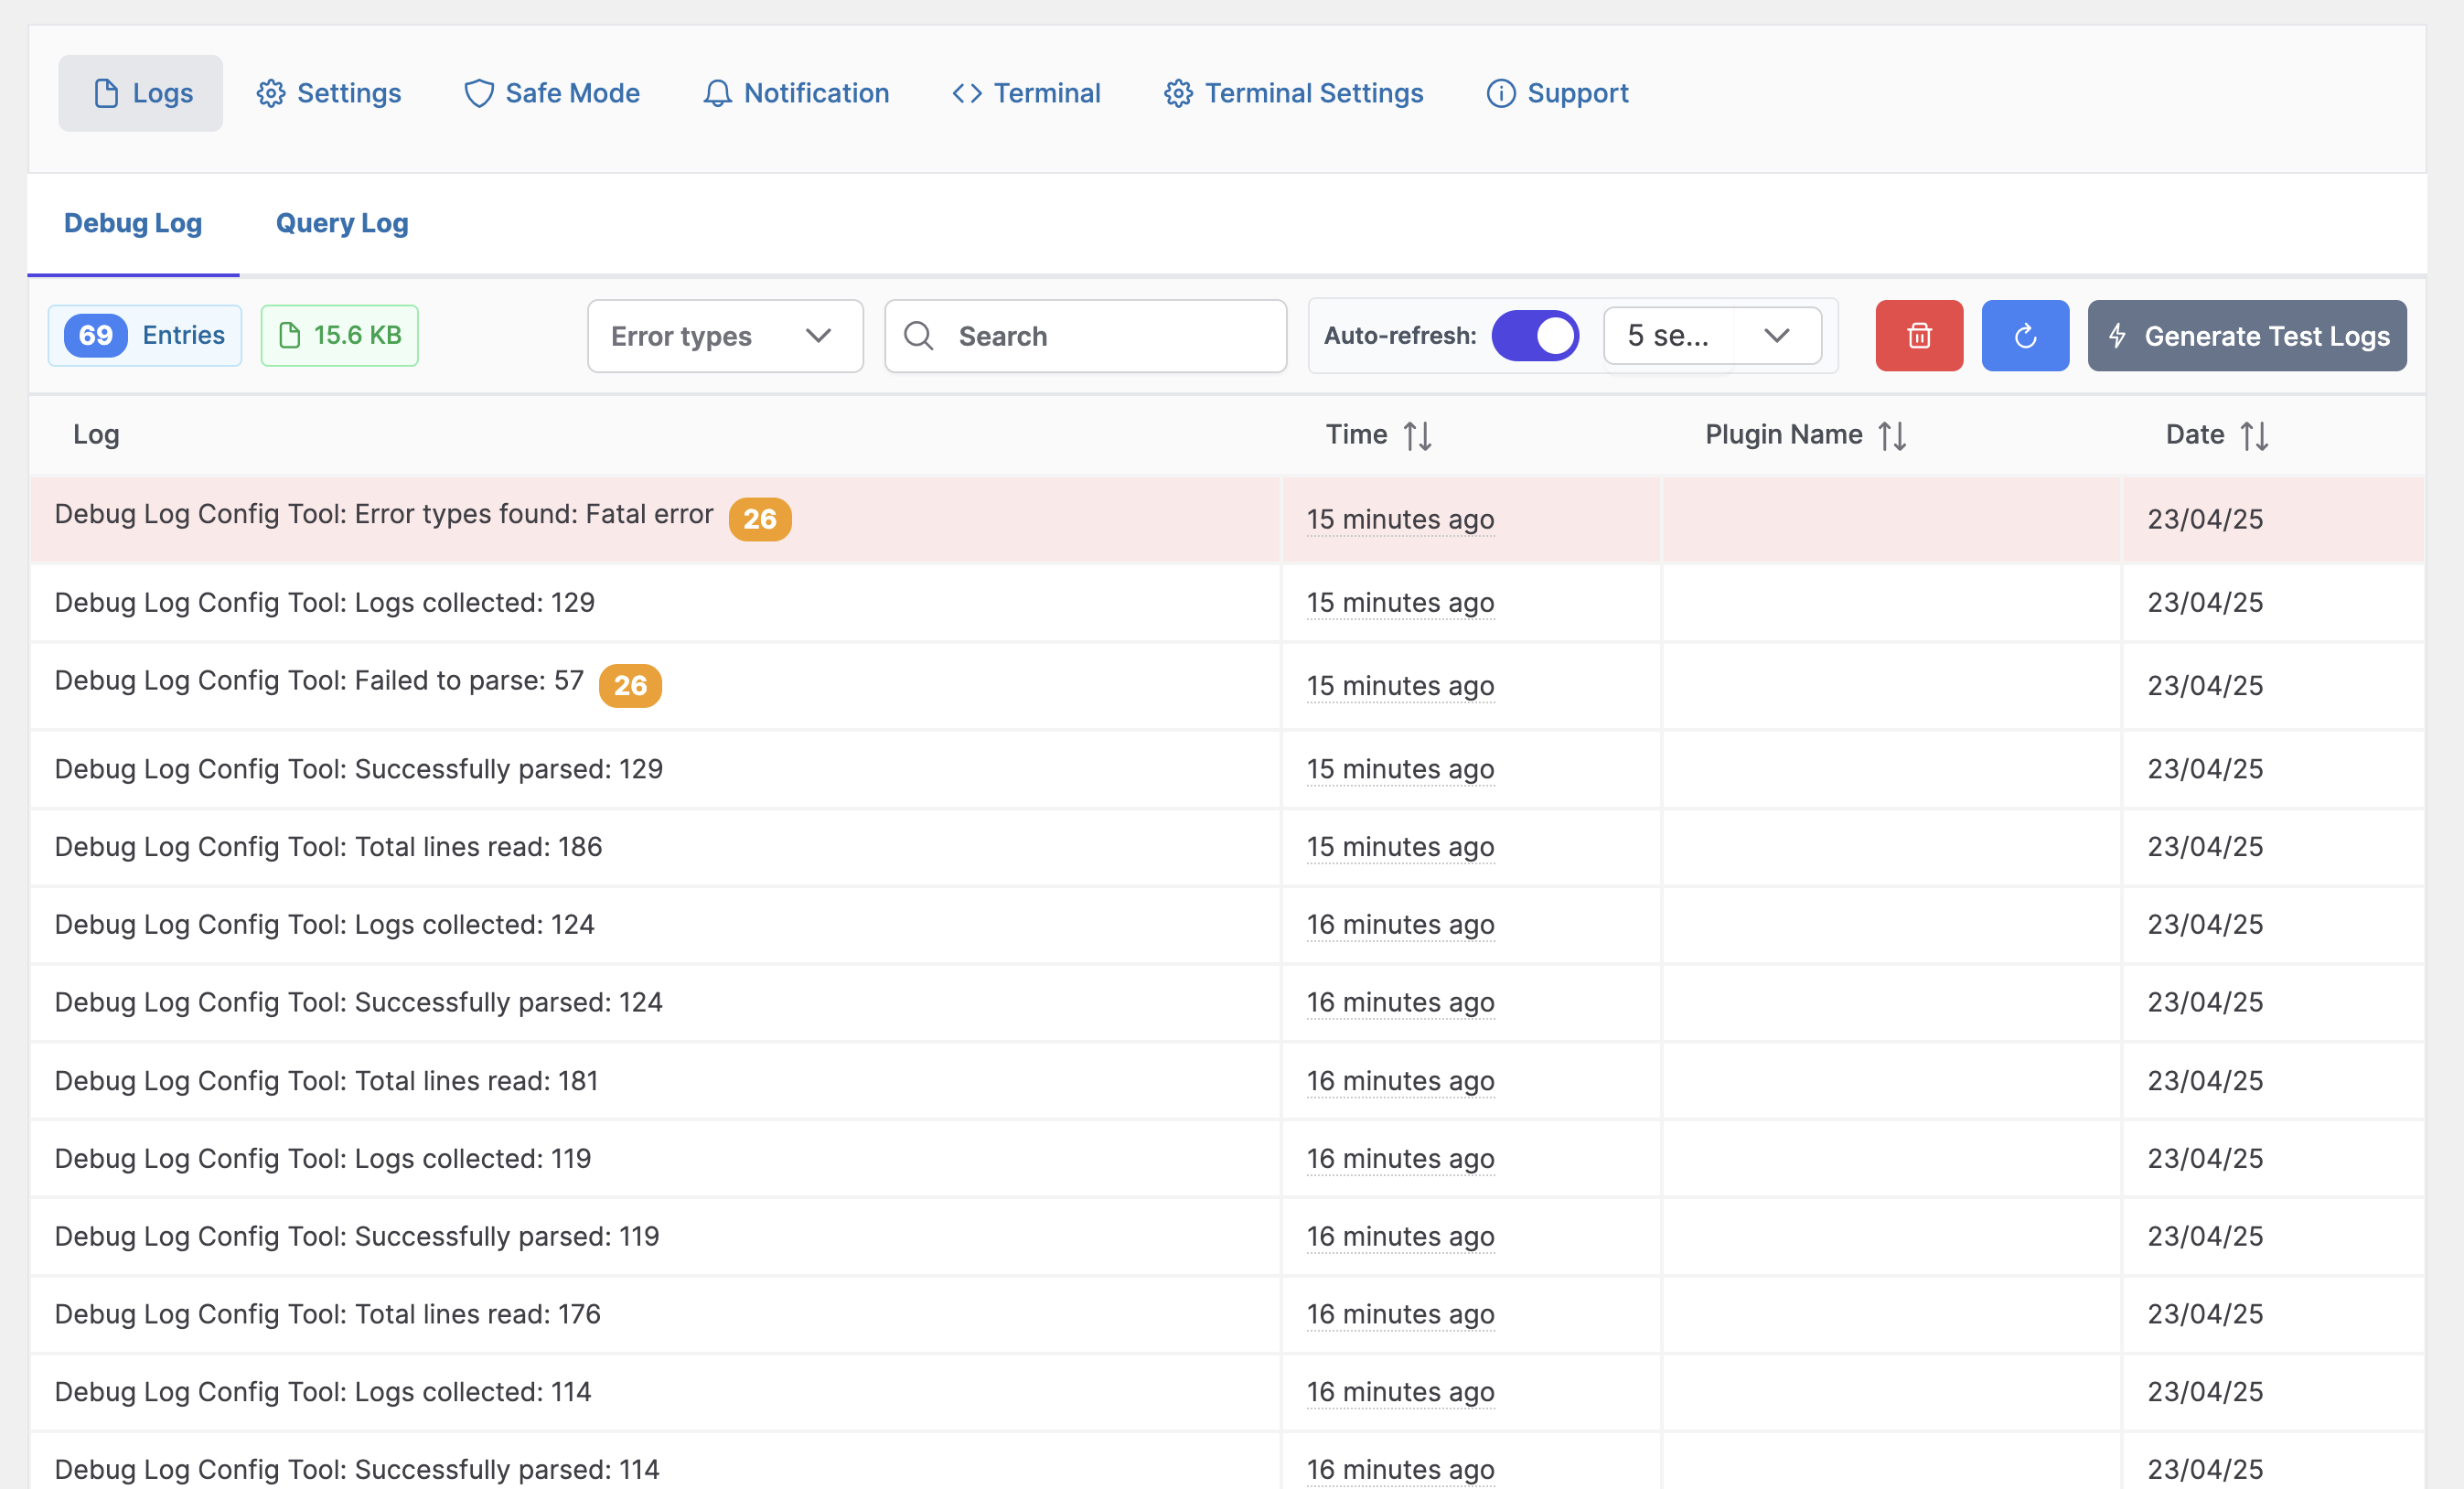
** Debug Log ** 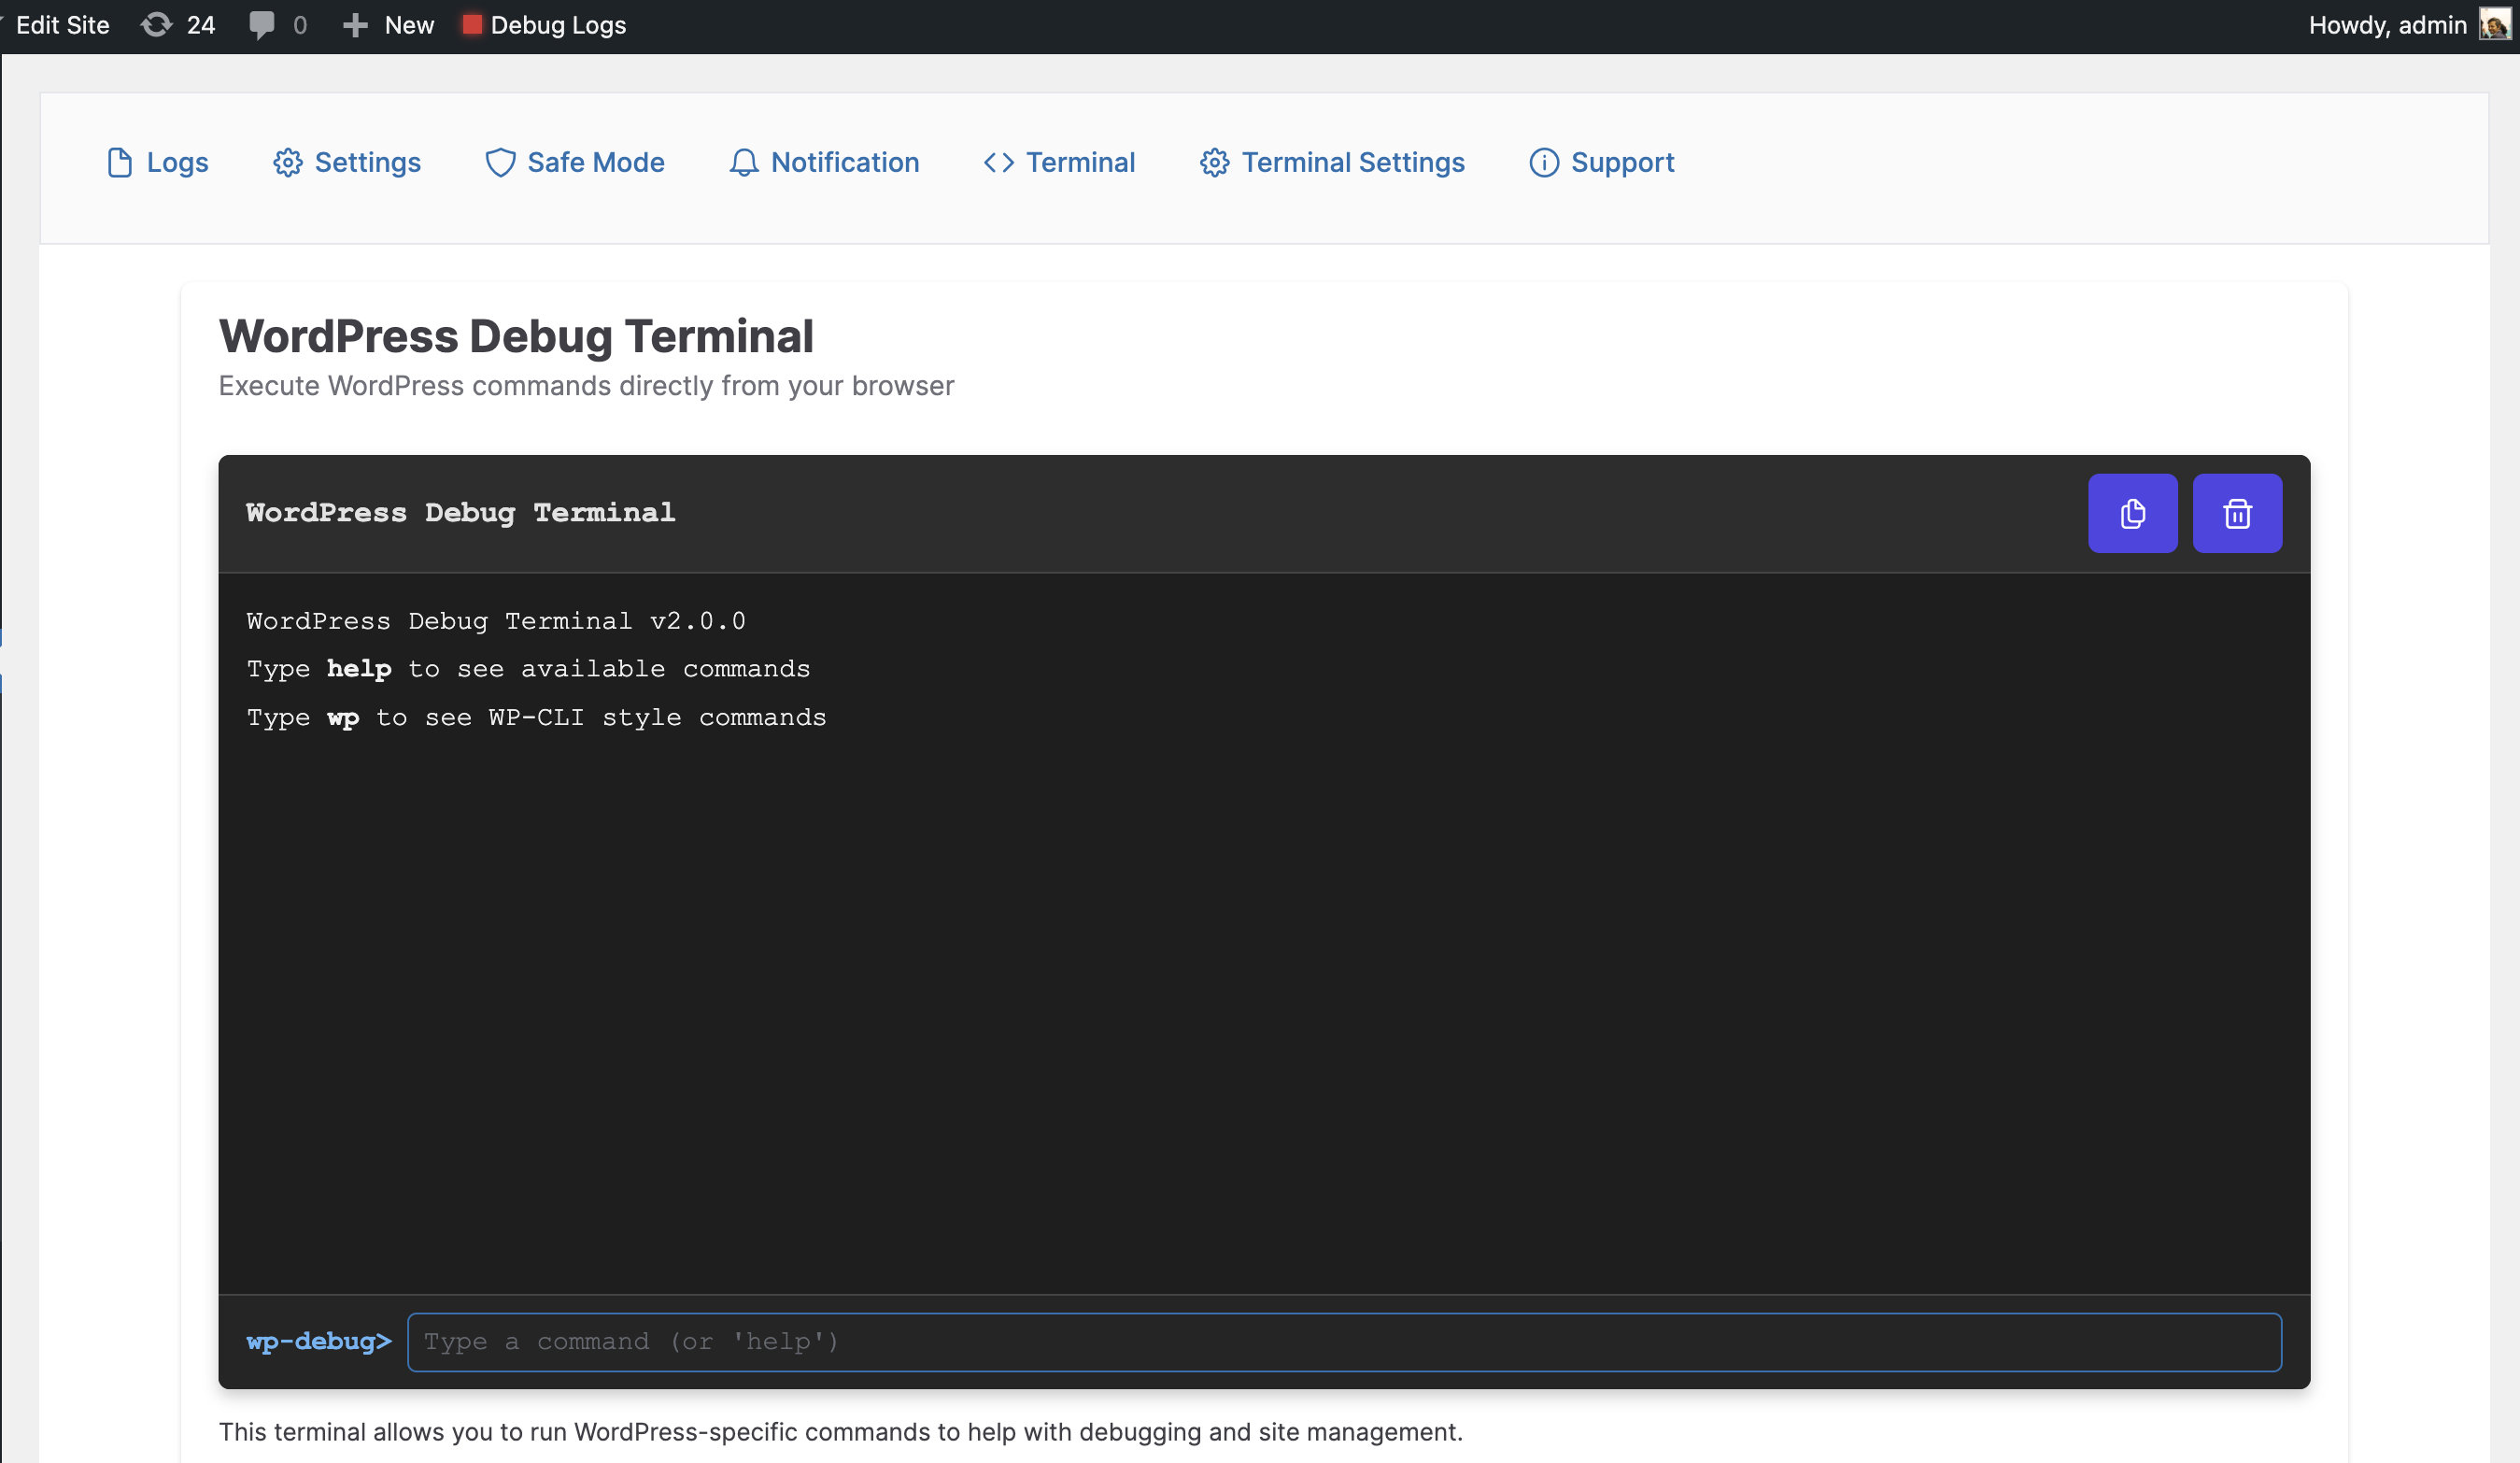
Instalacija
- Upload the plugin files to the
/wp-content/plugins/debug-log-config-tooldirectory, or install the plugin through the WordPress plugins screen directly. - Activate the plugin through the ‚Plugins‘ screen in WordPress
- Go to Tools-> Debug Logs screen to see the debug logs or access it from the top navbar.
FAQ
-
Do I need file manager/ftp or modify wp-config.php fie ?
-
No, just activate the plugin and turn off/on debug mode from plugin settings
-
Can I see full debug in dashboard?
-
Yes you can see a simple log in dashboard widget and nicely formatted view in the plugin
-
What does safe mode do?
-
Safe mode will deactivate all the plugin except the selected one. When you turn safe mode off it will restore all the previous activated plugin.
Reviews


Sobustatkujuce a wuwijarje
„Debug Log – Manager Tool“ jo software wótwórjonego žrědła. Slědujuce luźe su pśinosowali k toś tomu tykacoju.
Sobustatkujuce
Translate “Debug Log – Manager Tool” into your language.
Interested in development?
Browse the code, check out the SVN repository, or subscribe to the development log by RSS.
Changelog
2.0.1
- Fix typo
- Fix memory issue
2.0.0
- Added WP-CLI style command structure in terminal (e.g.,
wp core version) - Added database commands with WP-CLI syntax (
wp db query,wp db tables, etc.) - Added terminal settings page to enable/disable terminal and database features
- Added super admin restriction for database commands
- Added support for SQL queries with proper security measures
- Added stack trace visualization for better error analysis
- Help command to show commands by category with organized sections
- Enhanced security for terminal commands (preventing SQL injection, restricting destructive commands)
- Quick Debug Toggle from admin bar (WP_DEBUG)
1.5.3
- Fix footer text on all page
1.5.2
- Added query logs
1.5
- Fixed Vulnerability of debug log file. Generating random file for debug.
- Added a new safe mode which will turn off all plugins excluding selected ones.
1.4.5
- Fixed refresh
1.4.2
- New Constants
- Removed database dependency
1.4.4
- Fixed Refresh Log
- Added dashboard widget
- Clean UI
- Refresh Log
- Email Notification
1.0.0
- Initial Version